How to Flatten Nested JSON for Power BI & Excel (Without Python)
Flattening JSON is the process of transforming hierarchical, nested data structures (standard in APIs) into flat, two-dimensional tables (standard in Excel and SQL).
If you are a Data Analyst, you know the pain: You get a JSON file from the Engineering team, but it's full of nested arrays and objects. Excel displays it as [object Object]. Power BI makes you click "Expand" fifty times.
There is a better way.
The Problem: "Nested" Data
Most APIs return data like this. It's efficient for computers, but terrible for analysts:
If you try to convert this directly to CSV, you usually get a mess. The "Address" field just says "{...}" and you lose the city and zip code.
The Solution: Visual Flattening
Instead of writing a Python script using pandas.json_normalize, you can use JsonExport to do it visually in your browser.
Step 1: Load Your Data
Simply paste your code or upload your file. Because JsonExport runs 100% locally in your browser, your data never leaves your computer. This is critical for financial or PII data.
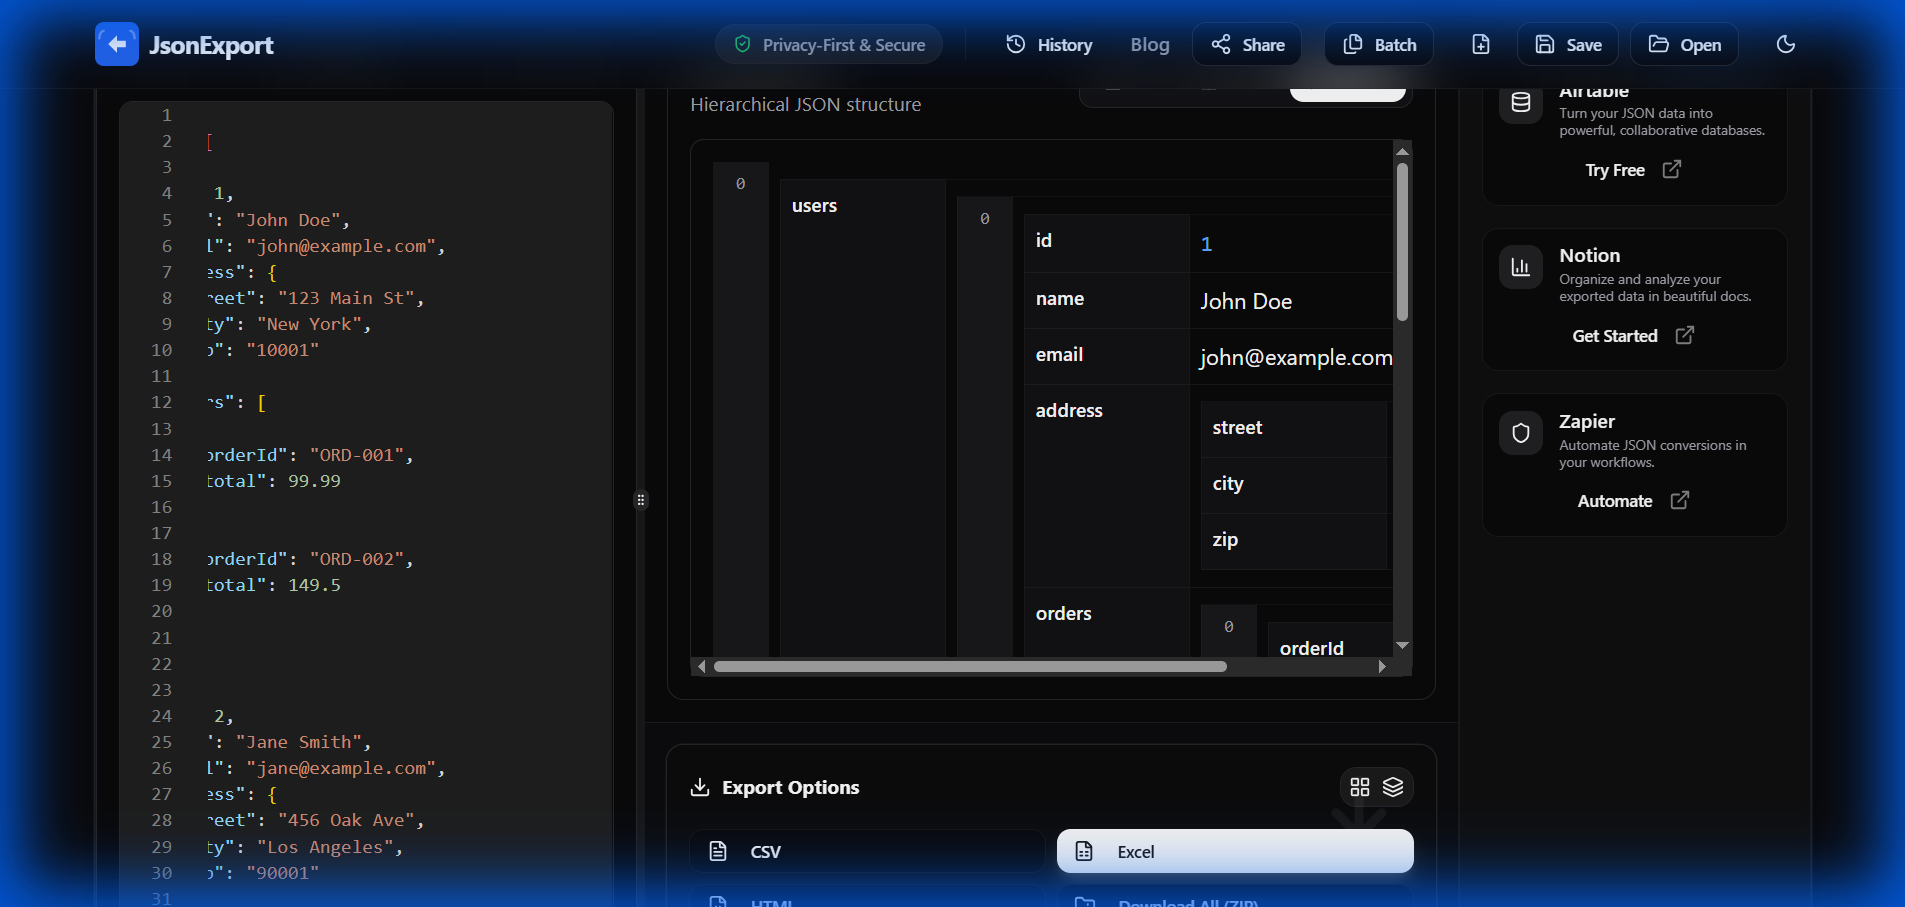
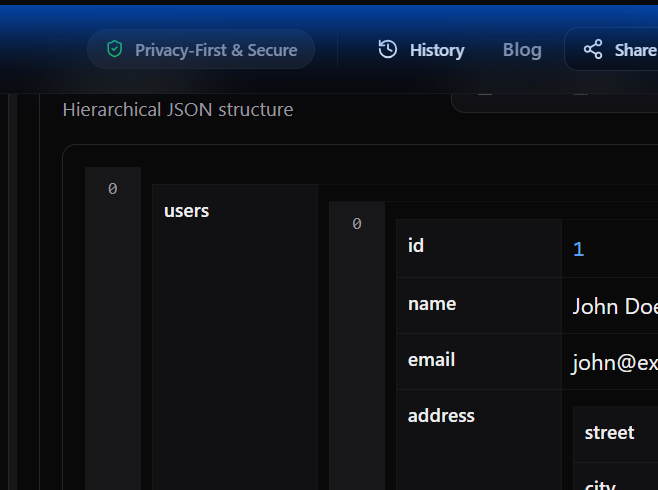
Step 2: Instant Flat View
The engine automatically detects nested objects and "flattens" them into dot-notation columns (e.g., user.address.city).

Notice how clean the data looks?
- No Code: You didn't write a single line of Python.
- No Errors: Arrays are handled automatically.
- Ready for Excel: Just click "Export to Excel" and it opens perfectly.
Step 3: Handling Deep Arrays (The "Nested" View)
Sometimes, flattening everything creates too many rows (the "cartesian product" problem). For this, use the Nested View. It keeps your parent data unique while showing child data (like "Orders") as a sub-table.
Why This Matters for Power BI & Tableau
Tools like Power BI and Tableau are amazing at visualization but mediocre at data prep. By using a specialized JSON Flattener before you import:
- Speed: You skip the slow "Power Query" transformation steps.
- Accuracy: You can visually verify the data structure before import.
- Performance: Your BI dashboards load faster because they ingest clean, flat data.
Ready to clean your data? Try the Analyst Workbench Now - It's free and private.